Kestrel Expert Advisor Backtest: The Full Report
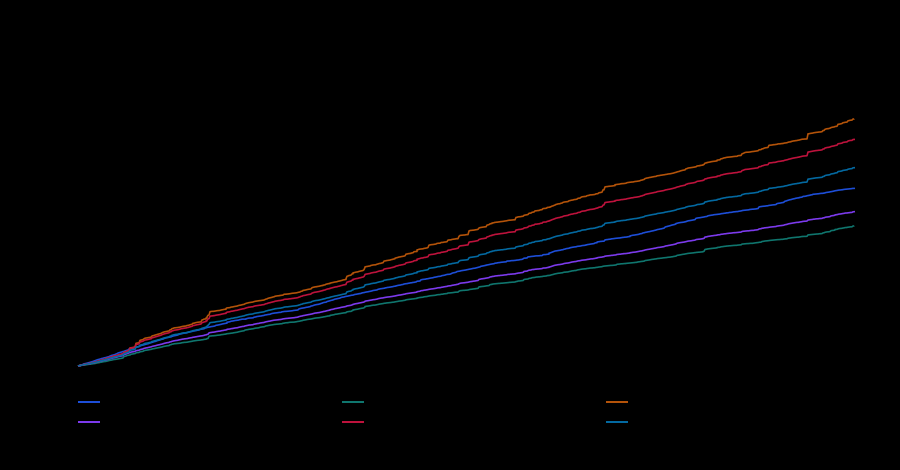
This expert advisor backtest report covers eleven simulated records: EURUSD and AUDCAD from 2010 to September 2026 — the 2026 months on a different data feed — GBPUSD from 2010 to 2025 and EURCAD from January 2014 to 2025, all on Dukascopy data. The method, the coverage and the limits of the simulation sit on the same page as the numbers.
See pricing and licence levels

How the backtest was run
Where these figures come from. The records on this site are produced by our own simulation engine rather than by the trading platform’s tester. Before publishing any of them we checked that engine against an independent, order-by-order record of the same strategy on the same pair: it reproduces 98.6% to 99.3% of the openings and 99.96% of the basket targets, and the largest position it ever opens is the same one.
The engine does not charge swap, commission or slippage, and it closes a basket at its exact target. That makes it optimistic on profit and honest on risk: its profit comes out roughly 10% to 17% above the independent record, while drawdown, worst floating loss and maximum open lots agree to within about 5%.
We publish the engine’s numbers with that gap written down, because the gap runs in the direction that flatters us. If you want the conservative reading, take about 15% off every profit figure on this page and leave every risk figure exactly where it is. The more charts a combination runs, the larger that haircut should be, because the costs we do not charge are paid once per chart.
On EURUSD the independent record reports a deeper drawdown than our engine measures, and we have not resolved why. The reference capital covers the deeper of the two readings.
The starting lot is fixed and never compounds with the account, and the results are in euros at fixed rates of 0.853 per dollar and 0.6213 per Canadian dollar. The basket is the unit being measured, not the single trade. Kestrel EA is a grid expert advisor for MetaTrader 4: it opens from its own signal, adds to the basket in small, capped steps when price moves against it, and closes the whole basket together at its target; until the basket closes, the loss is floating. Like the kestrel it is named after, it hovers, holds and closes once.
You choose one to four pairs — EURUSD, GBPUSD, EURCAD and AUDCAD — and for each pair Patient, Active or both (the Full portfolio below runs both AUDCAD variants): Patient adds to a basket less often and holds a smaller worst case; Active adds more often, returned more in the backtest and reached a larger worst case.
What each record covers
| Records | From | To | Feed | Why it ends there |
|---|---|---|---|---|
| EURUSD Patient and Active | January 2010 | 18 September 2026 | Dukascopy to December 2025, a different feed for 2026 | That is where the data we have ends |
| GBPUSD Patient and Active | January 2010 | 31 December 2025 | Dukascopy | No usable data for this pair in 2026 |
| EURCAD Patient and Active | January 2014 | 31 December 2025 | Dukascopy | The 2010–2013 history is not good enough to publish; including it would move the EURCAD Patient reference figure from about €10,300 to about €57,000 |
| AUDCAD Patient and Active | January 2010 | 18 September 2026 | Dukascopy and a different feed for the most recent months | That is where the data we have ends |
Results by portfolio
Horizon level, euros at fixed rates; the return and the yearly figure are measured on the reference capital for each record:
| Record | Period | Simulated profit | Return on that capital | Yearly, on that capital | Worst floating loss | Reference capital |
|---|---|---|---|---|---|---|
| EURUSD Patient | 2010 – Sep 2026 | €26,228 | +309% | 18.5% | −€2,788, 21 Aug 2024 | €8,500 |
| EURCAD Patient | 2014–2025 | €14,826 | +144% | 12.0% | −€3,408, 13 Mar 2017 | €10,300 |
| GBPUSD Patient | 2010–2025 | €30,025 | +257% | 16.0% | −€3,885, 14 Nov 2024 | €11,700 |
| AUDCAD Patient | 2010 – Sep 2026 | €34,066 | +243% | 14.6% | −€3,703, 22 Oct 2012 | €14,000 |
| EURUSD Active | 2010 – Sep 2026 | €44,232 | +297% | 17.8% | −€4,946, 18 May 2017 | €14,900 |
| EURCAD Active | 2014–2025 | €22,615 | +128% | 10.6% | −€5,887, 13 Mar 2017 | €17,700 |
| AUDCAD Active | 2010 – Sep 2026 | €87,089 | +429% | 25.7% | −€4,699, 13 Feb 2011 | €20,300 |
| GBPUSD Active | 2010–2025 | €53,725 | +251% | 15.7% | −€7,122, 31 Jul 2020 | €21,400 |
| K3 (AUDCAD Patient + EURUSD Patient) | 2010 – Sep 2026 | €60,294 | +268% | 16.0% | −€3,704, 22 Oct 2012 | €22,500 |
| K1 (AUDCAD Active + EURUSD Patient) | 2010 – Sep 2026 | €113,317 | +393% | 23.5% | −€4,701, 14 Feb 2011 | €28,800 |
| Full portfolio (AUDCAD Patient + AUDCAD Active + EURUSD Patient) | 2010 – Sep 2026 | €147,383 | +344% | 20.6% | −€6,165, 4 Mar 2016 | €42,800 |
For a single record the reference figure is three times its worst case; for a portfolio, the reference figures of its records added up. Simulated monthly averages over the backtest, not an income expectation: from €131 (EURUSD Patient) to €735 (Full portfolio) at Horizon. Summit and Zenith scale every figure by five and by ten. Every combination, with its stop-out floors: Kestrel Pair Combinations: What Fits Your Capital.
Results by year
Positive months and years per record, simulated on each window:
| Record | Period | Positive months | Positive years |
|---|---|---|---|
| EURUSD Patient | 2010 – Sep 2026 | 187 of 201 | 17 of 17 |
| EURUSD Active | 2010 – Sep 2026 | 187 of 201 | 17 of 17 |
| GBPUSD Patient | 2010–2025 | 174 of 192 | 16 of 16 |
| GBPUSD Active | 2010–2025 | 184 of 192 | 16 of 16 |
| EURCAD Patient | 2014–2025 | 132 of 144 | 12 of 12 |
| EURCAD Active | 2014–2025 | 131 of 144 | 11 of 12 |
| AUDCAD Patient | 2010 – Sep 2026 | 196 of 201 | 17 of 17 |
| AUDCAD Active | 2010 – Sep 2026 | 195 of 201 | 17 of 17 |
| K3 | 2010 – Sep 2026 | 192 of 201 | 17 of 17 |
| K1 | 2010 – Sep 2026 | 191 of 201 | 17 of 17 |
| Full portfolio | 2010 – Sep 2026 | 191 of 201 | 17 of 17 |
The only negative calendar year in the family is EURCAD Active’s 2014, its first year on record.
Month by month on EURUSD Patient
Percent of the 10,000 euro reference account this variant was run on, 2010 to 2025; the 2026 months come from a different data feed and are not in this table. The capital EURUSD Patient is sized at is €8,500.
| Year | Jan | Feb | Mar | Apr | May | Jun | Jul | Aug | Sep | Oct | Nov | Dec | Year |
|---|---|---|---|---|---|---|---|---|---|---|---|---|---|
| 2010 | +1.58 | +1.91 | +1.40 | +1.94 | +2.13 | +1.58 | +1.55 | +1.61 | +2.26 | +1.87 | +2.29 | -0.15 | +19.97 |
| 2011 | +2.60 | +3.12 | +1.69 | +1.48 | -0.64 | +4.29 | +1.74 | +1.70 | +1.92 | +1.74 | +1.54 | +1.37 | +22.56 |
| 2012 | +1.71 | +1.83 | +1.39 | +0.97 | +1.62 | +0.45 | +1.85 | +1.48 | +1.79 | +1.21 | +1.26 | +1.42 | +16.99 |
| 2013 | +0.72 | +1.78 | +1.08 | +1.13 | +1.26 | +1.11 | -6.90 | +8.82 | -6.74 | +8.71 | +1.12 | +0.77 | +12.85 |
| 2014 | +1.59 | +0.14 | +1.88 | +0.66 | +1.20 | +0.37 | +0.76 | +0.85 | -7.09 | +10.44 | +0.92 | +1.20 | +12.92 |
| 2015 | +2.06 | +1.12 | +1.75 | -13.01 | +16.29 | +1.53 | +1.21 | +1.72 | +1.27 | +1.14 | +1.00 | +1.44 | +17.54 |
| 2016 | +0.10 | +2.33 | +0.70 | +0.77 | +2.17 | +1.21 | +0.23 | +2.02 | +0.73 | +0.80 | +1.70 | +0.26 | +13.01 |
| 2017 | +1.45 | +1.64 | +0.25 | +2.15 | +0.91 | +2.56 | -0.54 | +2.79 | +1.00 | +1.45 | +1.24 | -0.49 | +14.40 |
| 2018 | +3.40 | +1.88 | +0.61 | +1.47 | +0.43 | +1.69 | +1.39 | +2.06 | +0.90 | +1.48 | +1.03 | +1.28 | +17.61 |
| 2019 | +0.50 | +1.03 | +1.51 | +0.39 | +0.56 | -0.43 | +2.64 | -3.11 | +6.62 | +0.65 | +0.42 | -1.55 | +9.24 |
| 2020 | +2.69 | +3.07 | +2.36 | +1.03 | +0.86 | +1.79 | +0.61 | +1.12 | +1.82 | +0.87 | +0.90 | +1.17 | +18.30 |
| 2021 | +0.91 | -1.03 | +4.46 | +1.96 | +0.47 | +1.45 | +0.65 | -0.40 | +1.90 | -0.13 | +2.80 | +0.84 | +13.88 |
| 2022 | +1.02 | +1.47 | +1.37 | +1.21 | +1.26 | +1.44 | +1.25 | +2.70 | +1.69 | +1.33 | +2.15 | +0.85 | +17.74 |
| 2023 | +0.85 | +1.73 | +1.17 | +2.58 | +0.80 | +1.15 | +1.67 | +1.06 | +0.64 | +0.56 | +1.21 | +0.86 | +14.27 |
| 2024 | +0.64 | +0.95 | +0.68 | +1.26 | +0.39 | +1.04 | +0.57 | +3.16 | +0.78 | +0.39 | +0.85 | +1.12 | +11.80 |
| 2025 | +1.55 | +0.92 | +2.47 | +1.82 | +1.03 | -4.95 | +3.15 | +4.96 | +1.17 | +2.27 | +0.43 | +0.83 | +15.65 |
177 of the 192 months closed positive; the worst, April 2015, closed −€1,301 at Horizon level and the best, May 2015, closed +€1,629 (simulated).
The limits of a simulation
- No swap, commission, slippage or cost of funding margin, and the broker stop-out never fires inside the simulation — the floors it would have produced are on Kestrel EA Risk Management and Capital for MT4 Portfolios.
- The exact minute a basket closes inside a data bar is not visible, and the engine closes it at its exact target, which reads optimistic on profit.
- No compounding: the lot never grows with the account, so the yearly figures are arithmetic averages, not a compound rate.
- Fixed exchange rates for the whole history; the currency risk of a CAD-settling pair is not measured.
- The 2026 months of EURUSD and AUDCAD come from a different data feed; measured against a broker feed in 2025 and 2026, the size of an episode moved by ten to forty per cent between providers.
- EURCAD starts in January 2014 because the earlier history of the pair is not good enough to publish.
- A future episode worse than every episode in these records is possible.
- Beyond the backtest, the software has run on two demo accounts since September 2026 — a forward test on demo, not a real account.
From here it is five steps: choose pairs and variant, choose the level whose reference capital fits your account, buy the annual licence — €999, €4,999 or €9,999, VAT included — install it on MT4 with its set file, and follow the record.
The risk side of the same runs is on Is Kestrel a Safe Expert Advisor? Drawdown and Worst Float, and the EURUSD variant on its own is described in Kestrel EURUSD Expert Advisor for MT4.
Frequently asked questions
Which data feed and spread were used?
Dukascopy data through our own simulation engine, with a fixed spread; before publishing, the engine was checked order by order against an independent record of the same strategy. The 2026 months of EURUSD and AUDCAD come from a different data feed.
Why do the records cover different periods?
Each record covers the data that is good enough to publish: EURUSD and AUDCAD run from 2010 to September 2026, GBPUSD ends in December 2025, and EURCAD starts in January 2014 because the earlier history of that pair produces an episode no other source reproduces.
Does the backtest include swap and commission?
No. The engine charges no swap, no commission and no slippage, and it closes a basket at its exact target, so its profit runs about 10% to 17% above an independent order-by-order record of the same strategy.
See pricing and licence levels
Last updated: